Read the ANSURII database
[ ]:
import os
from pathlib import Path

from IPython.display import Image

import configuration.utils.functions as fun
from streamlit_app.plot import plot

# Define the path of the project containing the data
cwd = Path(os.path.abspath(""))  # Current working directory
path_data = cwd.parent.parent / "data"

# Load the ANSUR II dataset from a pickle file
df_ANSURII = fun.load_pickle(str(path_data / "pkl" / "ANSUREIIPublic.pkl"))

# Define default attributes to display in the plot
default_attributes = [
    "Sex",
    "Height [cm]",
    "Chest depth [cm]",
    "Bideltoid breadth [cm]",
]
Display the chest depth histograms
[2]:
# Select an attribute to display (convert to lowercase for consistency)
selected_attribute = default_attributes[2]

# Generate a Plotly figure displaying the distribution of the selected attribute
fig = plot.display_distribution(df_ANSURII, selected_attribute)

# Display the generated Plotly figure in the documentation
fig.write_image(path_data / "images" / "generated" / "plot_database.png", format="png")
Image(path_data / "images" / "generated" / "plot_database.png")
[2]:

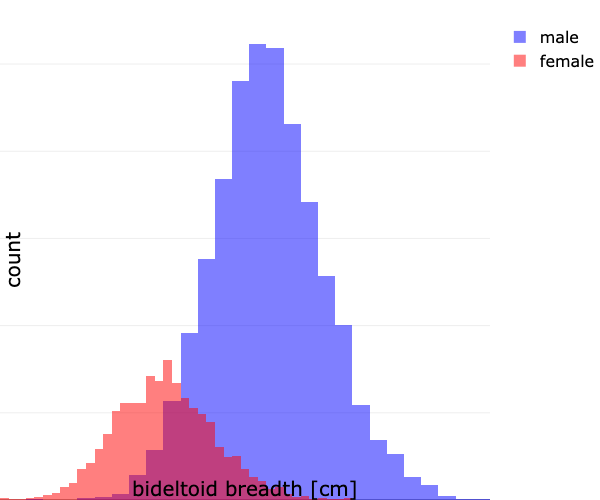
Display the bideltoid breadth histograms
[3]:
# Select an attribute to display (convert to lowercase for consistency)
selected_attribute = default_attributes[3]

# Generate a Plotly figure displaying the distribution of the selected attribute
fig = plot.display_distribution(df_ANSURII, selected_attribute)

# Display the generated Plotly figure in the documentation
fig.write_image(path_data / "images" / "generated" / "plot_database.png", format="png")
Image(path_data / "images" / "generated" / "plot_database.png")
[3]:
Display the first keys and data of the database
Many other parts of the body have been measured.
[4]:
print(f"Database keys:\n{df_ANSURII.keys()}")
Database keys:
Index(['subjectid', 'abdominalextensiondepthsitting', 'acromialheight',
       'acromionradialelength', 'anklecircumference', 'axillaheight',
       'balloffootcircumference', 'balloffootlength', 'biacromialbreadth',
       'bicepscircumferenceflexed',
       ...
       'PrimaryMOS', 'SubjectsBirthLocation', 'SubjectNumericRace',
       'Ethnicity', 'DODRace', 'Age', 'height [cm]', 'weight [kg]',
       'WritingPreference', 'sex'],
      dtype='object', length=109)